- The view of most economists is that the key driver of inflation is the strength of the economy. If monetary policy is too accommodative, then it can create too much demand and the economy can “overheat”, leading to higher rates of inflation. Conversely, if the economy weakens, then deflation, not inflation, becomes the key risk.
- This quintessentially Keynesian view of the world has been drummed into the minds of market participants by a succession of Fed officials, nearly all of whom have argued that the key role of the Fed is too ensure that the temperature of the economy remains “just right”, i.e. not too hot and not too cold.
- But does the strength of the economy really matter to inflation? Is “too much demand” the primary cause of inflation? And is it a given that a weak economy must result in deflation?
- The view of The Money Enigma is that excess demand is not the primary cause of inflation. Rather, the primary cause of rising prices over time is a fall in the value of money. While swings in the economic cycle may somewhat abate or accentuate an inflationary trend, the underlying trend is always determined by the value of money, not the value of goods.
When Did “Too Much Demand” Create Inflation?
If you listened only to Fed officials, then you might quickly come to the view that the rate of inflation is primarily a function of the strength of the economy: a strong economy produces higher levels of inflation and a weak economy produces low levels of inflation or even deflation. This is the prevailing view that is implicit in the thought process of most talking heads on CNBC and that appears in nearly every debate regarding the outlook for inflation.
However, the historical evidence for this proposition is thin.
While there have been numerous academic studies conducted on this issue, I’d like to encourage readers to step back from a moment and consider this question for themselves: “When did too much demand create inflation?”
What specific periods of history can you point to, either in the United States or any other country, where high levels of inflation have clearly been created by too much aggregate demand?
There are two ways you can approach this question. Either you can look at periods of high inflation and try to make some judgment about whether there was “too much demand” at the time, or you can look at periods of economic strength and see what happened to inflation during those periods.
While everyone will have a slightly different interpretation of history, the view of The Money Enigma is that it is very difficult to find any clear correlation between economic strength and inflation.
At the most basic level, it is well known that episodes of high levels of inflation, i.e. hyperinflation, have most commonly been associated with very weak economic conditions.
For example, one could hardly claim that hyperinflation in Zimbabwe in the 1990-2010 period was caused by “too much demand”! Similarly, one could hardly claim that prices are rising in Venezuela because Venezuela is the poster child of economic success!
Putting the issue of hyperinflation to one side, it is still very difficult to find clear anecdotal examples where economic strength created to inflation.
For example, the late 1990s was one of the strongest economic periods in US history. During the late 1990s, unemployment was low, consumer spending was high and capital spending, particular on technology, was off the charts.
So, what happened to inflation in the US during the late 1990s? It fell. Inflation fell from 3% in 1995 to sub 2% by 1997-98 and only staged a recovery back to the 3% rate in the last part of 1999 when the participation rate jumped to a record high. In this example, a stronger economy actually seemed to lead to a low inflationary trend, with a small cyclical bump in inflation right at the point that the economy was blowing steam.
Conversely, we can think of the stagflation in the 1970s. In the 1970s, inflation rose from a 5% annual rate and peak at nearly 15%. This peak in the rate of inflation in 1979-1980 was not marked by “good economic times” but rather an economy operating at stall speed.
Clearly, this type of anecdotal evidence does not supply us with a scientific analysis of the issue. However, many academic studies of this issue have been undertaken and the results are, at best, inconclusive.
In technical terms, the notion that “too much demand creates inflation” is known as the Phillips Curve. The Phillips Curve is a core part of New Keynesian thought and the current economic orthodoxy practiced by the major central banks. In essence, the Phillips Curve states that there is an inverse relationship between the rate of unemployment and the rate of inflation. Stated simply, as the economy approaches full employment, wages and prices must rise.
John Hussman, fund manager and economist, provides an excellent critique of the Phillips Curve and the empirical evidence supporting it in his post “Will the Real Phillips Curve Please Stand Up?”
In simple terms, Hussman’s point is that if there is a strong inverse correlation between unemployment and inflation, then that should show up on a chart plotting unemployment against inflation. It doesn’t. Economists have tried to prove the relationship by adjusting the models, but even then the relationship between unemployment and inflation remains elusive.
One Price, Two Values
If the notion that “excess demand causes inflation” is not supported by empirical evidence, then why do so many economists cling to the idea? Why do market commentators persist with the fable that a “strong economy” equals inflation and a “weak economy” equals deflation?
Part of the reason for the persistence of this myth is that it is easy to communicate. Most people understand the basic microeconomic concept that, all else remaining equal, more demand for a good leads to a higher price for that good. Therefore, it is easy for people to extrapolate this idea from one good to many: if there is more demand for all goods, then the price of all goods should rise.
The problem is that, at a macroeconomic level, the forces of price determination are far more complex than this and one simply can’t carry-forward the set of microeconomic assumptions that are associated with basic supply and demand analysis.
At a more fundamental level, the problem with the basic supply and demand analysis described above and presented in most economics textbooks is that provides a partial, one-sided and incomplete view of the microeconomic price determination process.
The view of The Money Enigma is that every price is a relative measurement of the market value of two goods. For example, the price of apples in terms of money is a relative expression of both the market value of apples and the market value of money. The price of apples in money terms can rise for one of two reasons: either (a) the market value of apples rises or (b) the market value of money falls.
Most people believe that “price” and “market value” are synonymous, i.e. they mean the same thing. The view of The Money Enigma is that they are very different. “Market value” is a property possessed by economic goods. “Price”, on the other hand, is merely one method of measuring this property. More specifically, price is a relative measurement of the property of market value: a price measures the market value of one good in terms of another good.
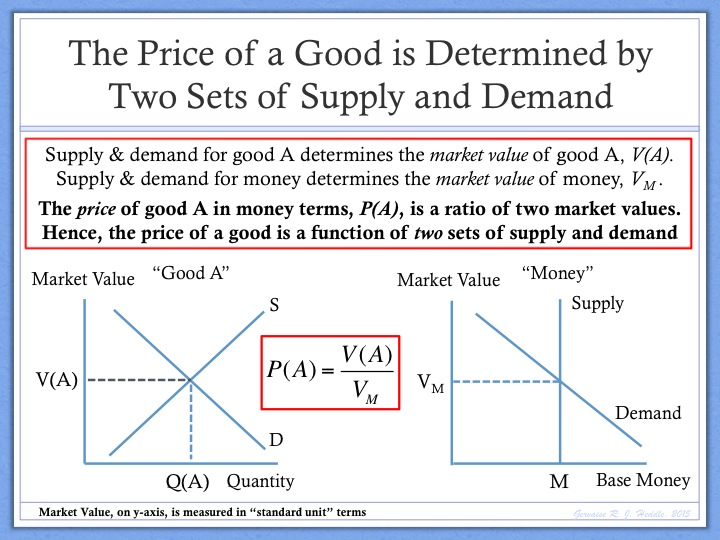
In mathematical terms, we can say that the price of a good is a ratio of two market values, where each of those market values are measured in “absolute terms”, i.e. in terms of a “standard unit” of measurement. [The measurement of market value is a complicated but important topic and I would highly encourage you to read a recent post on this issue titled “The Measurement of Market Value: Absolute, Relative and Real”.]

If this basic theory is correct, then it suggests that every price is determined by not one, but two sets of supply and demand. Supply and demand for apples determines the market value of apples. Supply and demand for money (the monetary base) determines the market value of money. The price of apples in money terms is determined by the ratio of these two market values.
Now, why is this microeconomic theory relevant to our discussion regarding the relationship between excess demand and inflation? Well, this microeconomic theory of price determination can be extended to a macroeconomic theory of price level determination.
If every price is a relative measurement of the market value, then the price level itself is also a relative measurement of market value. More specifically, the price level measures the market value of the basket of goods in terms of the market value of money. In this sense, the price level can be considered to be a ratio of two market values. [See “Ratio Theory of the Price Level” for a more detailed discussion].

Ratio Theory implies that the price level can rise for one of two reasons. Either (a) the market value of the basket of goods rises, or (b) the market value of money falls. In other words, either the numerator in the equation above rises or the denominator falls.
The problem with most commentary regarding the outlook for inflation is that it implicitly focuses only on the numerator in our price level equation.
Shifts in aggregate demand and supply for goods and services can certainly impact the market value of these goods and services. Moreover, an economy that is “overheating” may well experience a temporary rise in the market value of goods.

However, while these are important factors in near-term price level determination, the view of The Money Enigma is that they are primarily cyclical factors and do not explain changes in the inflationary trend. For example, “too much demand” can’t explain why the inflationary trend rose in the 1970s, or why it fell in the 1990s, or why Zimbabwe experienced hyperinflation in the 2000s.
The Value of Money and Inflation
If changes in the numerator, the “market value of basket of goods”, can not explain major shifts in the underlying inflationary trend, then clearly there is only one other factor that can explain these shifts: the denominator in our equation, the “market value of money”.
The view of The Money Enigma is that excess demand is not the primary driver of the long-term trend in inflation. Rather, the primary driver of rising prices as measured over long periods of time is a fall in the value of money.
In terms of our price level equation, swings in the economic cycle will impact the value of goods (the numerator in our equation) and this may somewhat abate or accentuate an inflationary trend. However, the underlying trend is always determined by changes in the value of money (the denominator in our equation).
The “value of money” is a concept that most economists struggle with. The reasons for this are complex and are discussed in a recent post “The Value of Money: Is Economics Missing a Variable?”
In essence, the problem relates to one of measurement. The “value of money” is generally measured in relative terms: for example, the “purchasing power of money” measures the value of money in terms of the value of goods (it is, after all, simply the reciprocal of the price level). However, in order to isolate the “value of money” as its own independent variable, one must measure the value of money in absolute terms, i.e. in terms of a “standard unit” for the measurement of market value.
If this all sounds a bit too technical, then think of it this way. The money in your pocket has value. If it didn’t you wouldn’t accept it in exchange and others wouldn’t accept in exchange. The value of money goes up and down. Moreover, it goes and down independently of the value of other goods, such as apples, and it does up and down independently of the value of the basket of goods.
If the value of money declines significantly over a period of time, then, all else remaining equal, the price of other goods in money terms will rise. Why? Well, if each unit of money becomes less valuable, then people will ask for more units of money for each apple sold or each hour worked.
The view of The Money Enigma is that major shifts in the price level and the inflationary trend are driven by changes in the value of money and the rate of depreciation of the value money respectively.
For example, the price level in the United States has risen roughly tenfold since the 1950s. Does it seem more likely that this tenfold increase in prices has been driven by (a) an excess of aggregate demand for most of the last fifty years, or (b) a decline in the value of the US Dollar due to growth in the monetary base that has dramatically exceeded real output growth?
Frankly, (a) is implausible. The US economy has experienced many periods of slack and weakness over that time that could have easily unwound any temporary inflationary pressures due to “too much demand”. In contrast, (b) is entirely plausible, particularly if one believes that money is a claim on the output of society and that the value of money depends primarily upon the growth of real output relative to the monetary base.
In summary, the view of The Money Enigma is that excess demand can, at least temporarily, lead to an acceleration of inflation. However, in most cases, the impact is likely to be short-lived and is largely irrelevant to the underlying inflationary trend that should concern policymakers.
The primary driver of the core inflationary trend is not excess demand, but rather the decline in the value of money that results when policymakers grow the monetary base at a rate that exceeds the growth in real output.